CRYPTOUSDUA
vip
On-chain Analyst
Futures Trading Strategist
Peak Tier5
An influential figure in the crypto space and content creator on SQUARE with a community of over 106,000 subscribers!
📊 Technical Analysis (BMT/USDT):
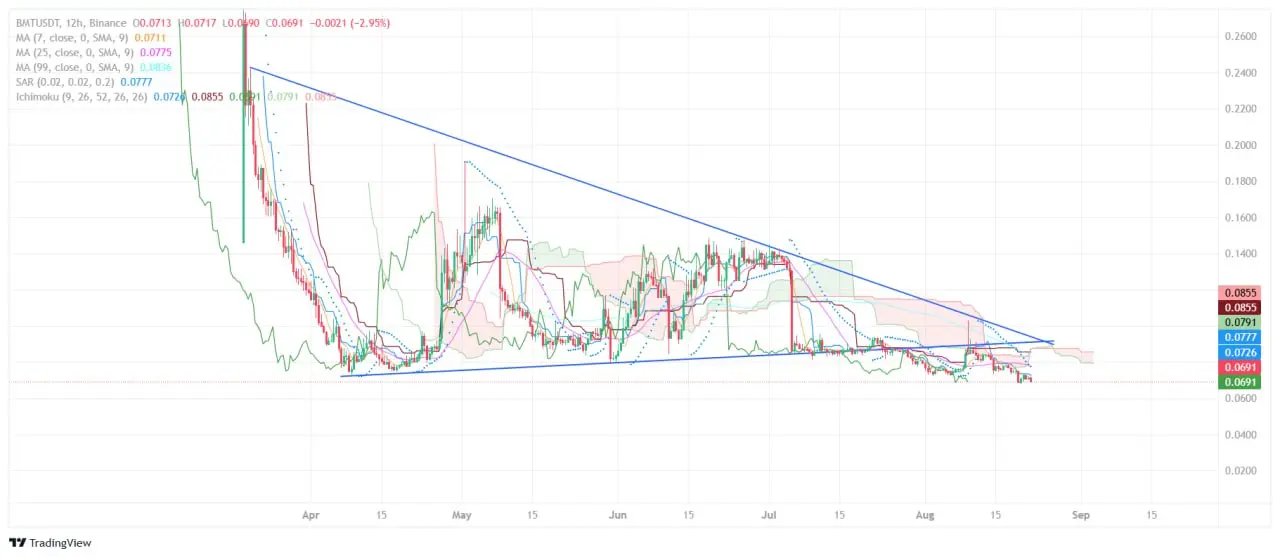
The chart is forming a descending triangle with support in the range of 0.069–0.072$ and resistance at 0.077–0.079$. A breakout downwards will open the way to 0.06$, while a consolidation above 0.079$ will give a chance for growth to 0.085–0.09$. The price is trading below the Ichimoku cloud — a signal of bearish pressure.
🔗 Fundamental (Bubblemaps):
Bubblemaps is an on-chain analytics platform that turns raw data into convenient visualizations. The service shows the distribution of tokens, clusters, and hidden connections useful for trading, compliance, and
BMT-2.96%
View Original
post-image
[The user has shared his/her trading data. Go to the App to view more.]
  • Reward
  • Comment
  • Repost
  • Share
📊 Technical Analysis (BounceBit/USDT, 3D):
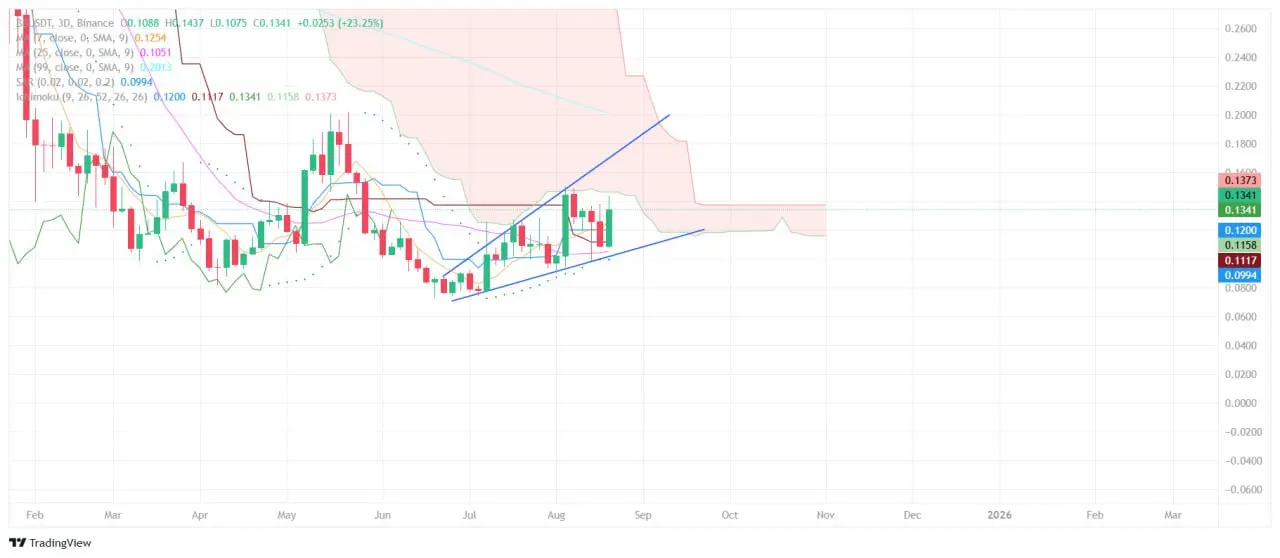
An ascending wedge is forming on the chart — a pattern that usually indicates the possibility of a correction after a rise. The price is held above the key support of 0.115–0.120$, which indicates the strength of buyers. The upper resistance boundary is currently around 0.137–0.140$. A consolidation above this level may open the way to 0.16–0.18$, while a breakdown of support downwards will return the price to the zone of 0.10–0.099$.
Indicators:
📈 The price is above EMA(25) and EMA(7), indicating a local bullish momentum.
☁️ The Ichimoku Cloud rema
BB8.79%
BTC-0.65%
DEFI11.35%
View Original
post-image
[The user has shared his/her trading data. Go to the App to view more.]
  • Reward
  • Comment
  • Repost
  • Share
📊 Technical Analysis:
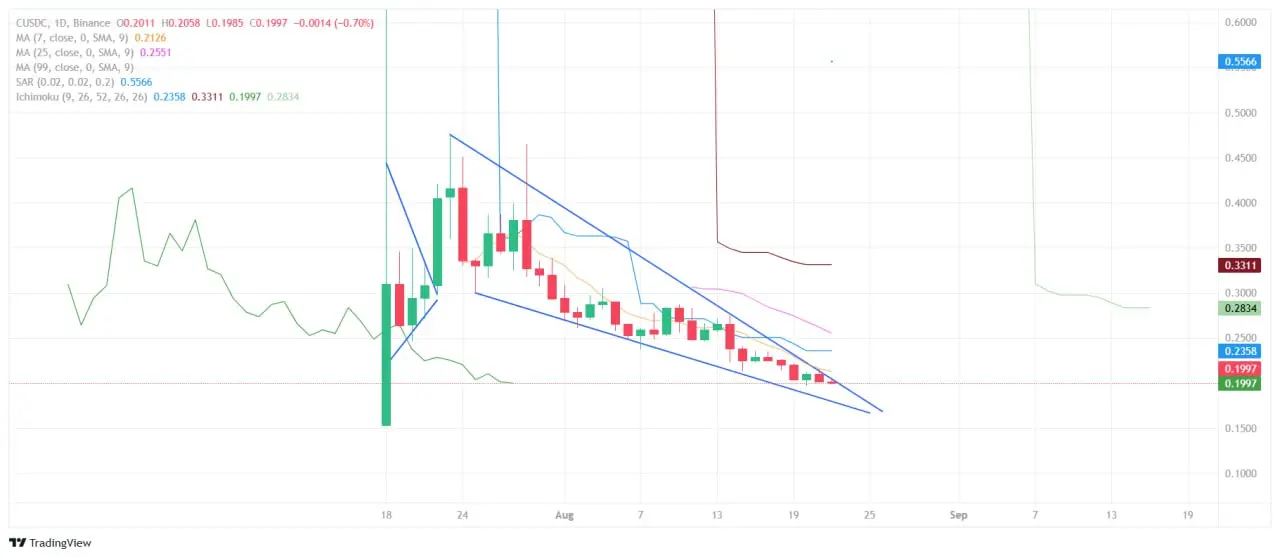
On the chart of $C, a falling wedge pattern is observed, which is often considered a bullish pattern. The price is gradually compressing within a narrow range, while the volumes are decreasing — a typical signal of a possible breakout. The current support is forming around 0.19–0.20$, while key resistances are located in the 0.23–0.25$ zone. A breakout of the wedge upwards could act as a catalyst for growth to higher levels, whereas a consolidation below support would open the way for a decline.
🔗 Fundamental:
Chainbase is a decentralized infrastructure platform for Web
C-3%
View Original
post-image
[The user has shared his/her trading data. Go to the App to view more.]
  • Reward
  • Comment
  • Repost
  • Share
🚀 BTC Dominance: what's next?
Today, BTC Dominance is holding at 59.4%, near the key support of 59.2%.
In recent months, we have seen a breakout of the ascending channel, and now Bitcoin is gradually losing market share.
📉 What does this mean?
When dominance falls, altcoins start to show better dynamics. This is a classic signal for a possible alt season.
🔎 Picture by levels:
Support: 59.2% ( key zone from where a rebound is possible ).
Resistance levels: 60.4% – 60.9% – 62.4%.
If 59.2% does not hold, the next target for decline: 55% and even 50%.
📊 Scenarios:
Bullish: a rebound upwards fr
BTC-0.65%
View Original
[The user has shared his/her trading data. Go to the App to view more.]
  • Reward
  • 2
  • Repost
  • Share
GateUser-c8cac84fvip:
Thank you for your sharing.
View More
🔥 Let's analyze the chart and the project $Kava (#KAVA ):
📊 Technical Analysis:
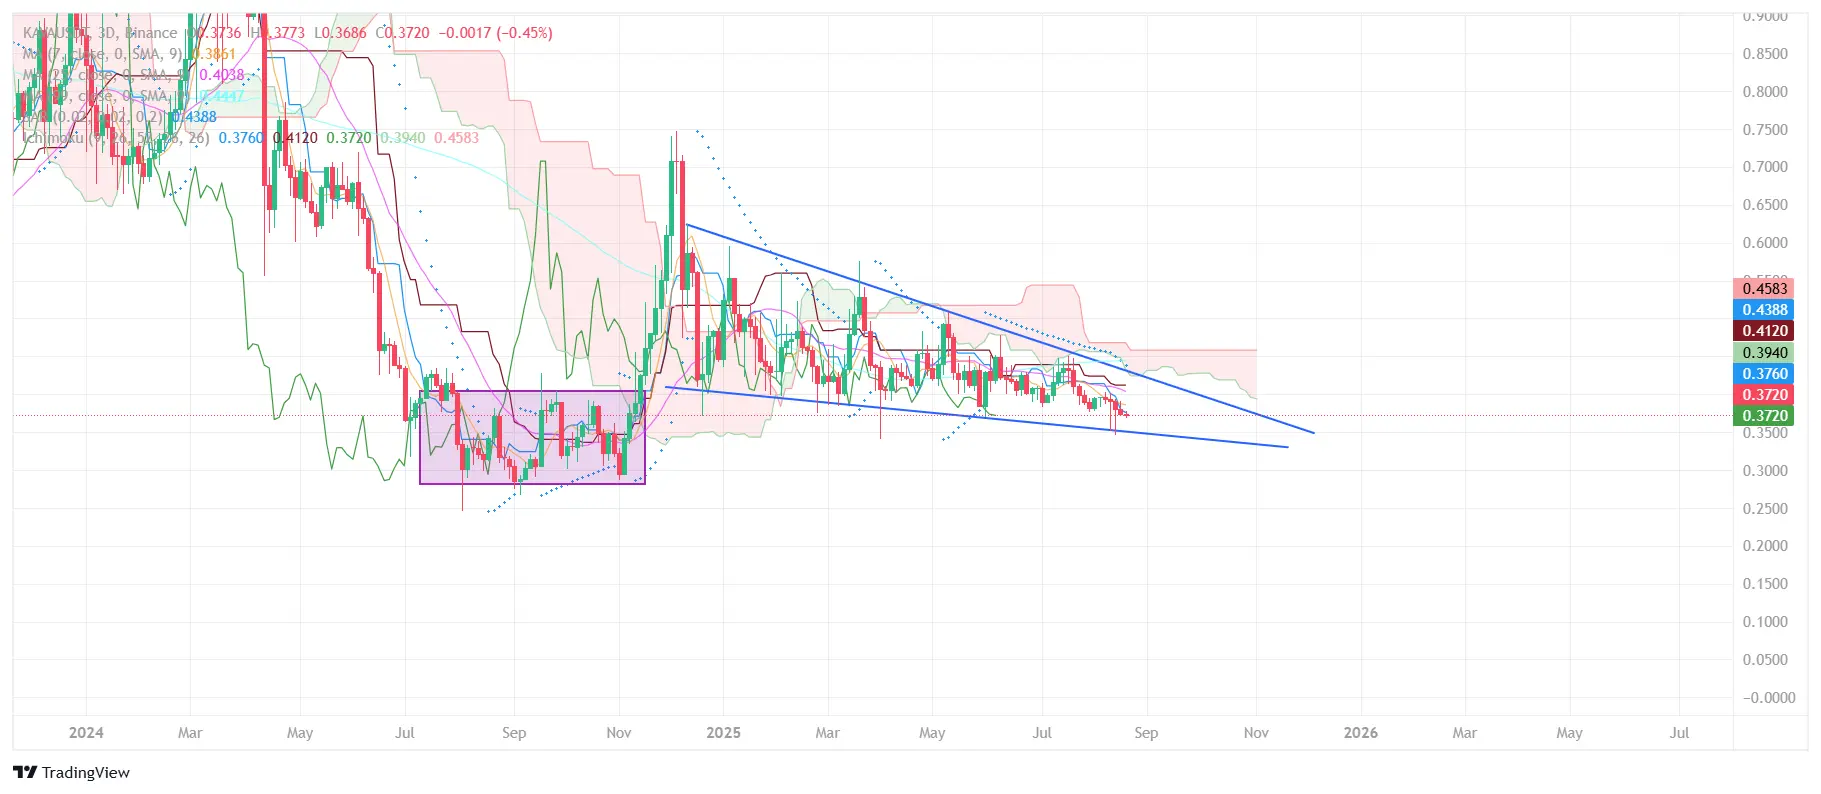
The chart shows the formation of a falling wedge ( — this is usually considered a bullish pattern 📈, but for now, the price is consolidating at the lower boundary.
The support level is currently around $0.35–0.37 🛡️. If it holds, there is a chance for a rebound.
Resistance levels: $0.41 → $0.44 → $0.46 🚧. A breakout above $0.46 may provide upward momentum.
Indicators )Ichimoku, EMA( are currently showing weakness in the trend — the asset is under the cloud, bearish pressure remains 🐻.
The volumes are low, whi
KAVA-0.45%
ETH0.88%
VIRTUAL-3.19%
ATOM-2.16%
View Original
post-image
  • Reward
  • 2
  • Repost
  • Share
San9oldvip:
Buy to Earn 💎
View More
📰 BlackRock sold $1,940 BTC for $220.7 million
This could signal profit-taking amid local volatility or portfolio rebalancing. Large sales from institutional players often put pressure on the price, but the BTC market remains resilient if demand from other participants compensates for these volumes.
BTC-0.65%
  • Reward
  • Comment
  • Repost
  • Share
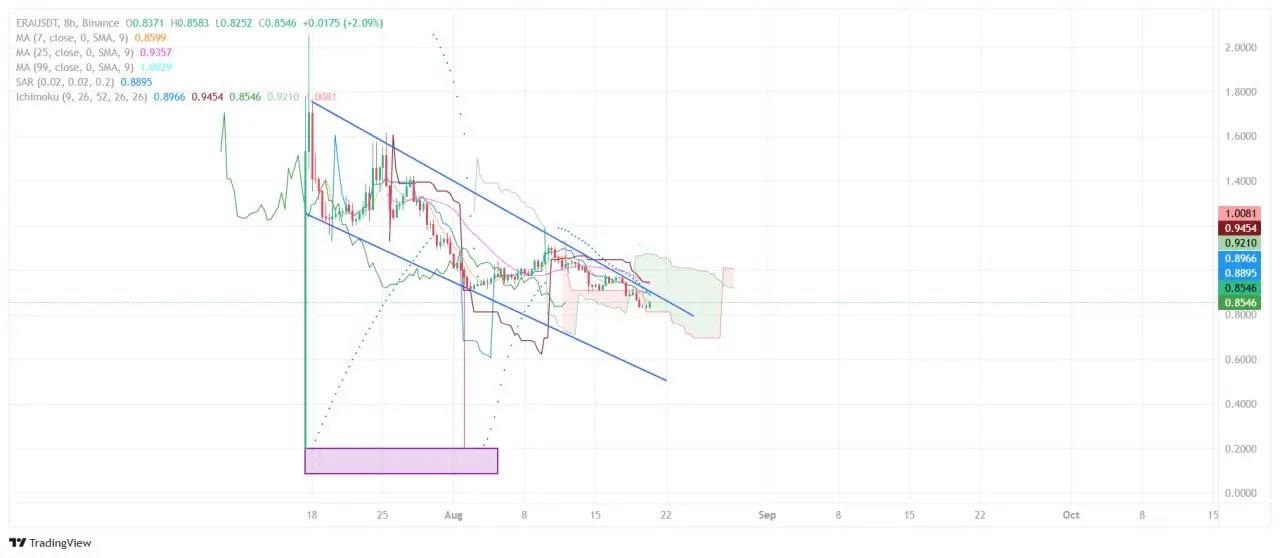
📊 Analysis of ERA/USDT (8H)
The chart shows the formation of a descending channel, from which the price is attempting to break out upwards 📈. The current level of $0.85 is holding support, a break of the $0.89–0.92 zone will open the way to $1.00 🚀. Ichimoku indicates a possible exit from the cloud, which strengthens the bullish scenario. However, a close below $0.80 will again increase selling pressure ⚠️.
🔹 Fundamental:
Caldera (ERA) positions itself as "internet rollups" 🌐 — an ecosystem of modular and interconnected networks. The project offers customization of L2 solutions and flexib
ERA-2.86%
ZK-2.1%
View Original
post-image
[The user has shared his/her trading data. Go to the App to view more.]
  • Reward
  • Comment
  • Repost
  • Share
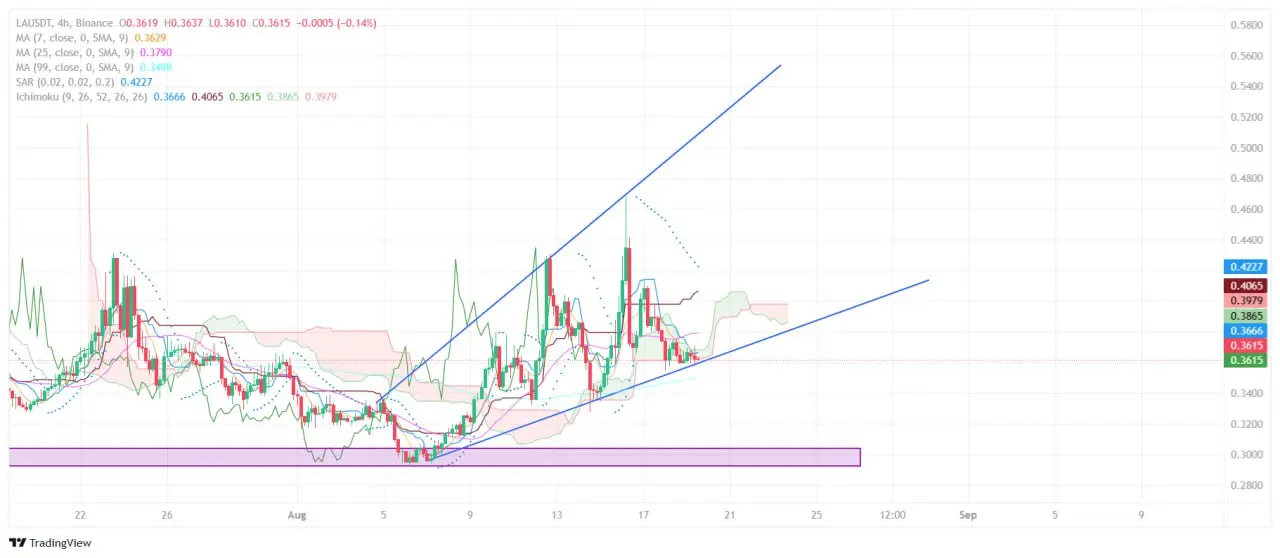
📊 Analysis of LA/USDT
On the 4H chart, it can be seen that the price of LA is held within an ascending channel 🔼, relying on the trendline support. The level of $0.36 acts as a key zone — its retention may provide momentum for a retest of resistances $0.386 – $0.406 🚀. The potential target if the trend continues is $0.42. If the support at $0.36 breaks, the price may return to the area of strong demand base $0.32–0.34 📉.
⚡ Fundamental
Lagrange is a promising Web3 project developing solutions based on Zero-Knowledge Proofs (ZK). Its technologies allow:
📡 provide cross-chain interaction
💻
LA-4.08%
ZERO-4.78%
ZK-2.1%
EIGEN1.48%
View Original
post-image
[The user has shared his/her trading data. Go to the App to view more.]
  • Reward
  • Comment
  • Repost
  • Share
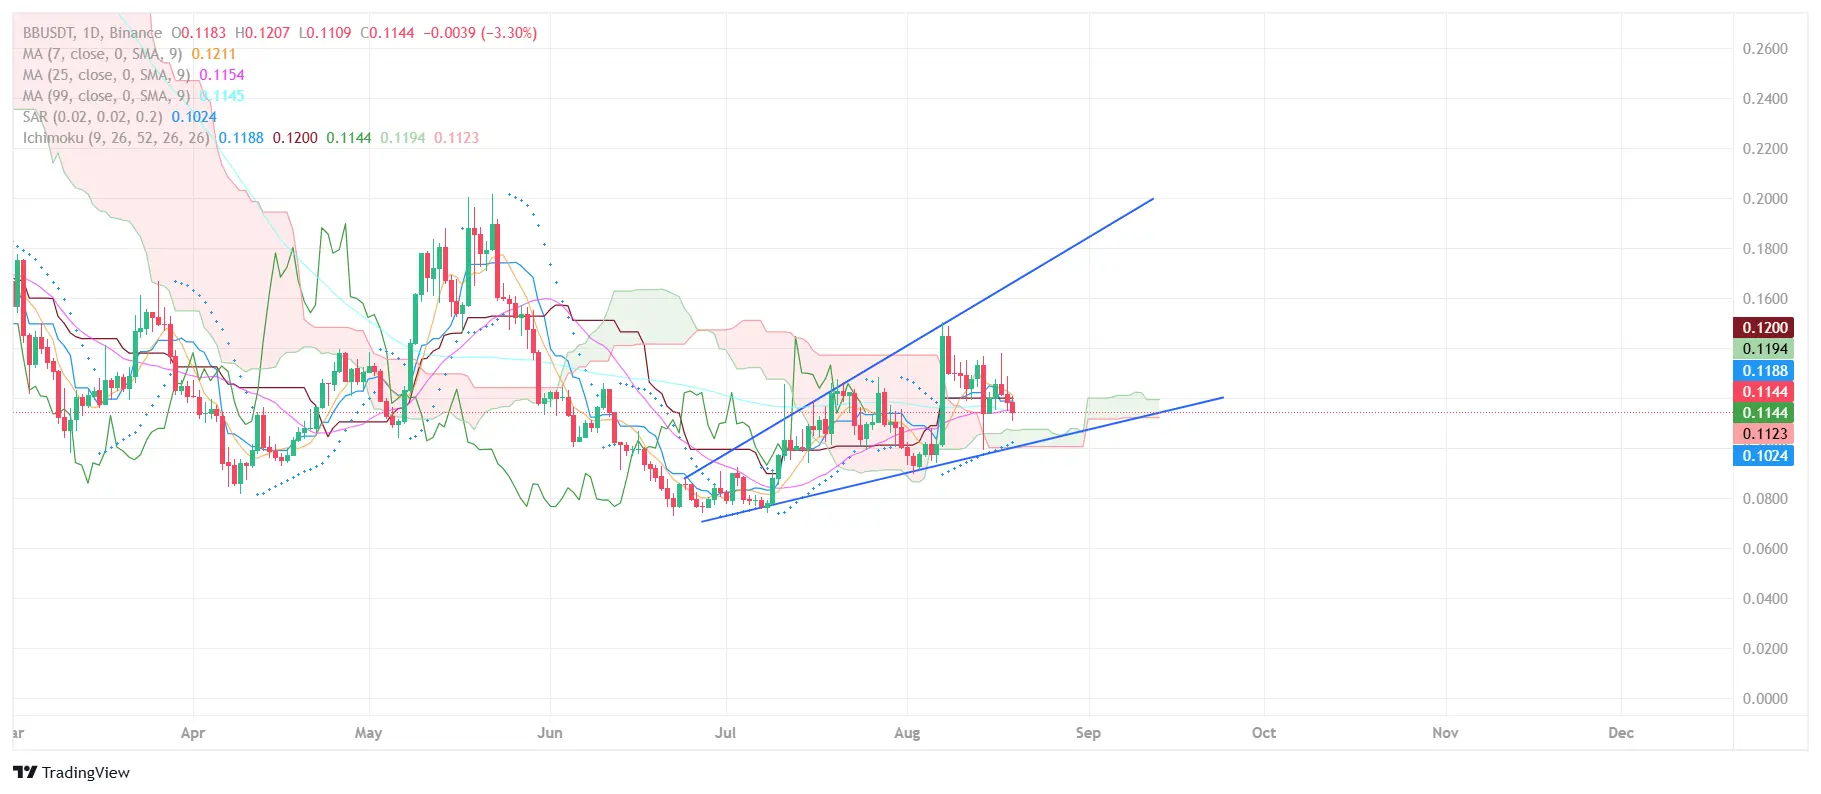
🚀 BB/USDT — technical and fundamental perspective
📊 Technique: On the daily chart, the asset is moving within an ascending wedge 📈. Currently, the price is testing support in the range of $0.112–0.114, below which the zone of $0.102 will become key for maintaining the bullish trend ⚖️. Resistance is forming at $0.12–0.125, a breakout above will open the way to $0.14+.
⚡ Fundamental: BounceBit — an innovative BTC restaking chain 🔗 that combines CeFi and DeFi. ✅ It gives Bitcoin holders the opportunity to earn yields from various sources 💰. ✅ Builds a CeDeFi framework, increasing liquidity
BB8.79%
BTC-0.65%
DEFI11.35%
View Original
post-image
  • Reward
  • 7
  • Repost
  • Share
GateUser-1c8a1331vip:
Watching Closely 🔍
View More
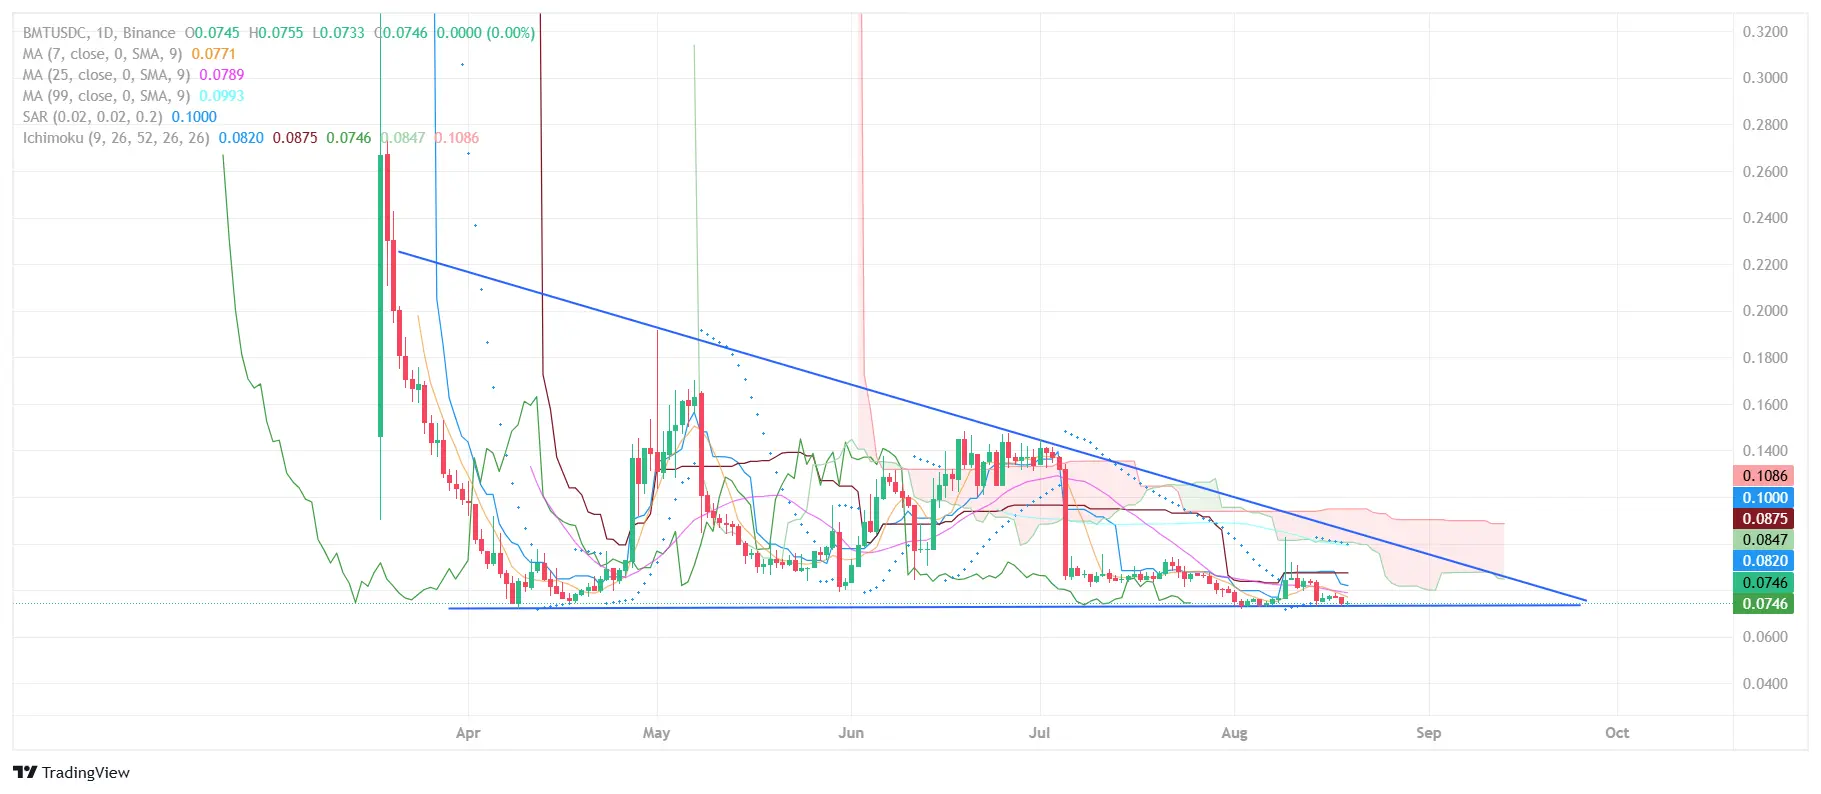
BMT/USDT — chart analysis + fundamental
📊 Technical overview: A narrowing descending triangle 🔻 is forming on the daily chart with support around $0.074–0.075. The price is consolidating at the lower boundary, indicating an accumulation phase 🤏. A downward breakout could take the asset to $0.065, while a close above $0.085–0.09 would provide a chance for a rebound to $0.10+ 💹.
⚡Bubblemaps — a powerful on-chain analytics tool 🧠🔍 that transforms raw blockchain data into visual insights: token distribution, clusters, and hidden connections. The $BMT token powers Intel Desk — a community lay
BMT-2.96%
View Original
post-image
  • Reward
  • 2
  • Repost
  • Share
B_2Evip:
Bull Run 🐂
View More
📉 BlackRock takes profit
The world's largest asset manager sells 490 BTC for $68.7M 💰
🔑 Comment:
Unlike Michael Saylor's strategy, BlackRock acts pragmatically - it fixes part of the position at local levels. This could be:
🔹 portfolio rebalancing,
🔹 risk reduction before volatility,
🔹 or preparation for a new accumulation phase.
⚡️ Bottom line: such institutional movements highlight different approaches - some accumulate for the long term (like Saylor), while others work according to the risk management model (like BlackRock).
BTC-0.65%
WORK4.49%
  • Reward
  • Comment
  • Repost
  • Share
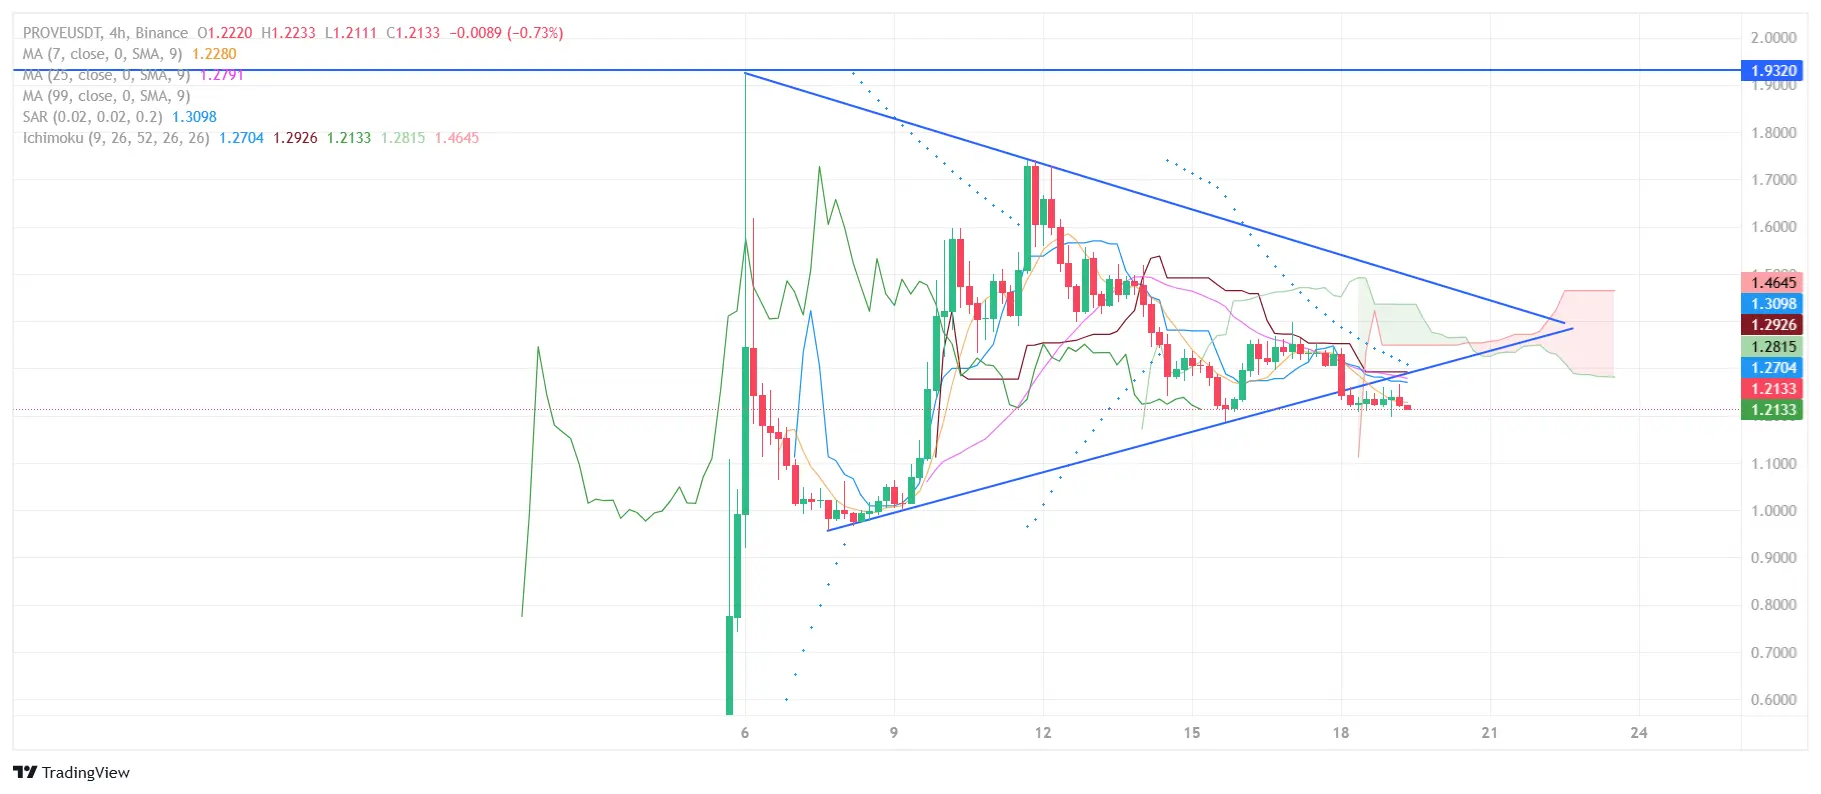
📊 PROVE/USDT — chart analysis
The chart shows the formation of a consolidation zone after the decline 📉. The price is moving in a narrow range, indicating liquidity accumulation 💠. Key support is located around $0.018 – $0.020, resistance — $0.025 – $0.027. A breakout above the trendline could trigger an impulse rise 🚀, while losing support would amplify the downward pressure ⚠️.
🔗 Fundamental: Succinct is a decentralized Prover Network that, together with SP1, makes zero-knowledge proofs (ZK) more accessible and scalable. The project addresses one of the key problems of Web3 — simplifyin
PROVE0.86%
ZERO-4.78%
ZK-2.1%
View Original
post-image
  • Reward
  • 3
  • Repost
  • Share
DrAmaniSooJPvip:
amazing sharing, thx ya...
View More
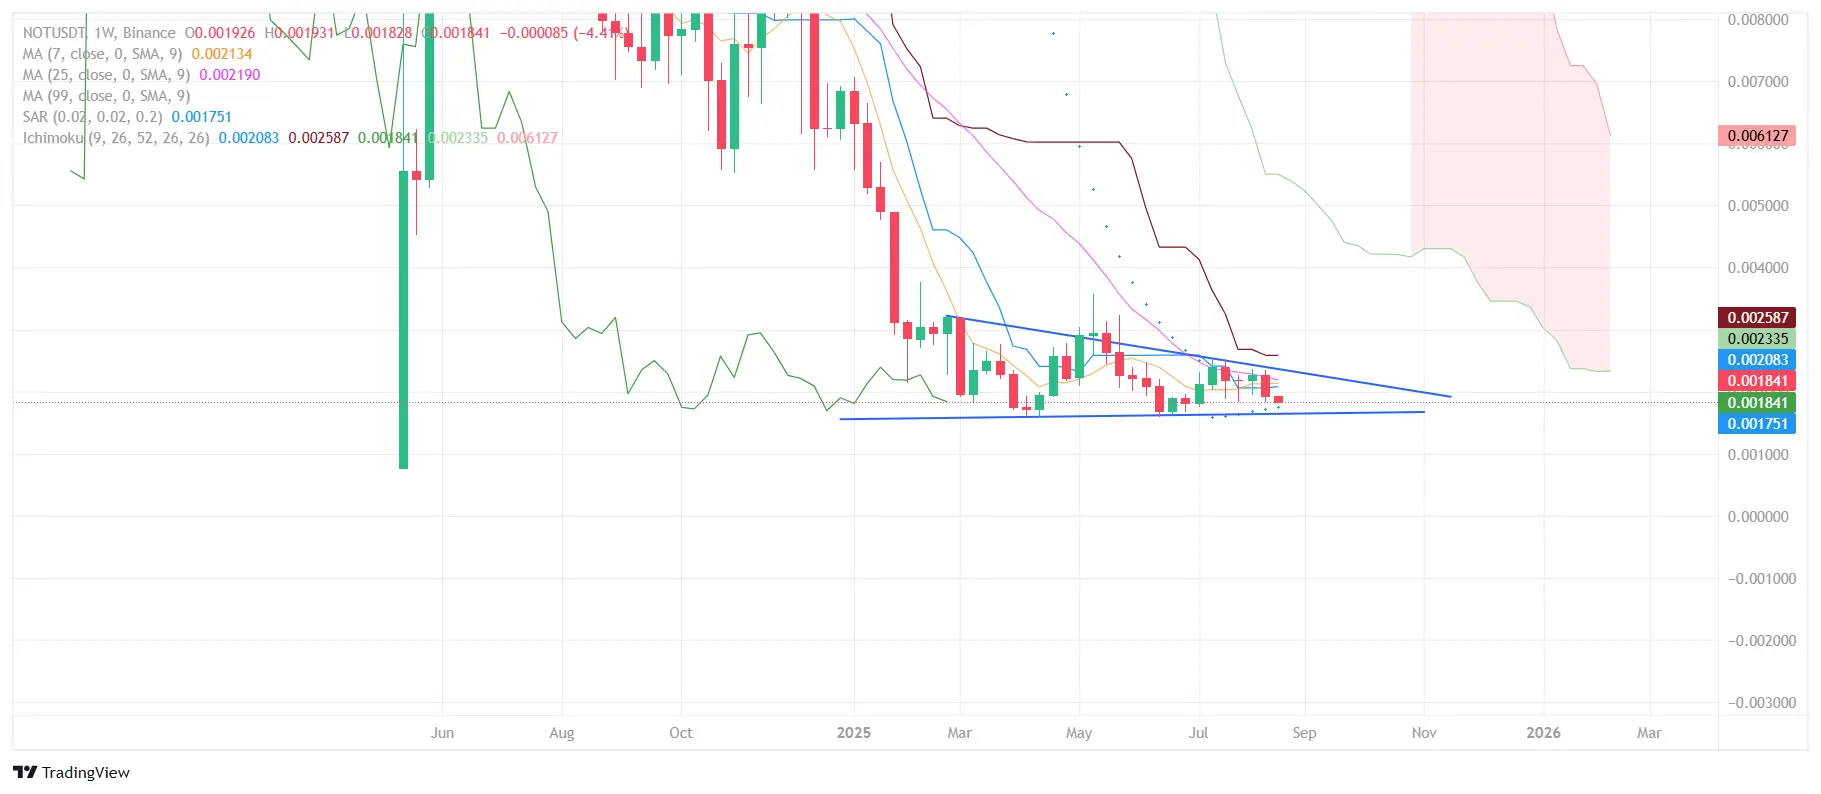
📊 NOT/USDT — weekly chart
On the chart, we see the formation of a descending triangle 🔻. The price is consolidating at a strong support zone of $0.00175 – $0.00180, where several rebounds have already occurred. A breakout above the resistance along the trendline ($0.0021 – $0.0022) could open the way for growth into the zone of $0.0026 – $0.0030 🚀. Losing support will lead to a decrease down to $0.0015 ⚠️.
🎮 Fundamentals: Notcoin — a top Web3 gaming project, deeply integrated into Telegram and supported by the TON Foundation. It has become one of the fastest "mass" onboardings in crypto th
NOT-1.45%
TON-1.72%
View Original
post-image
  • Reward
  • 2
  • Repost
  • Share
Dipu_srvip:
not was the trendy token
View More
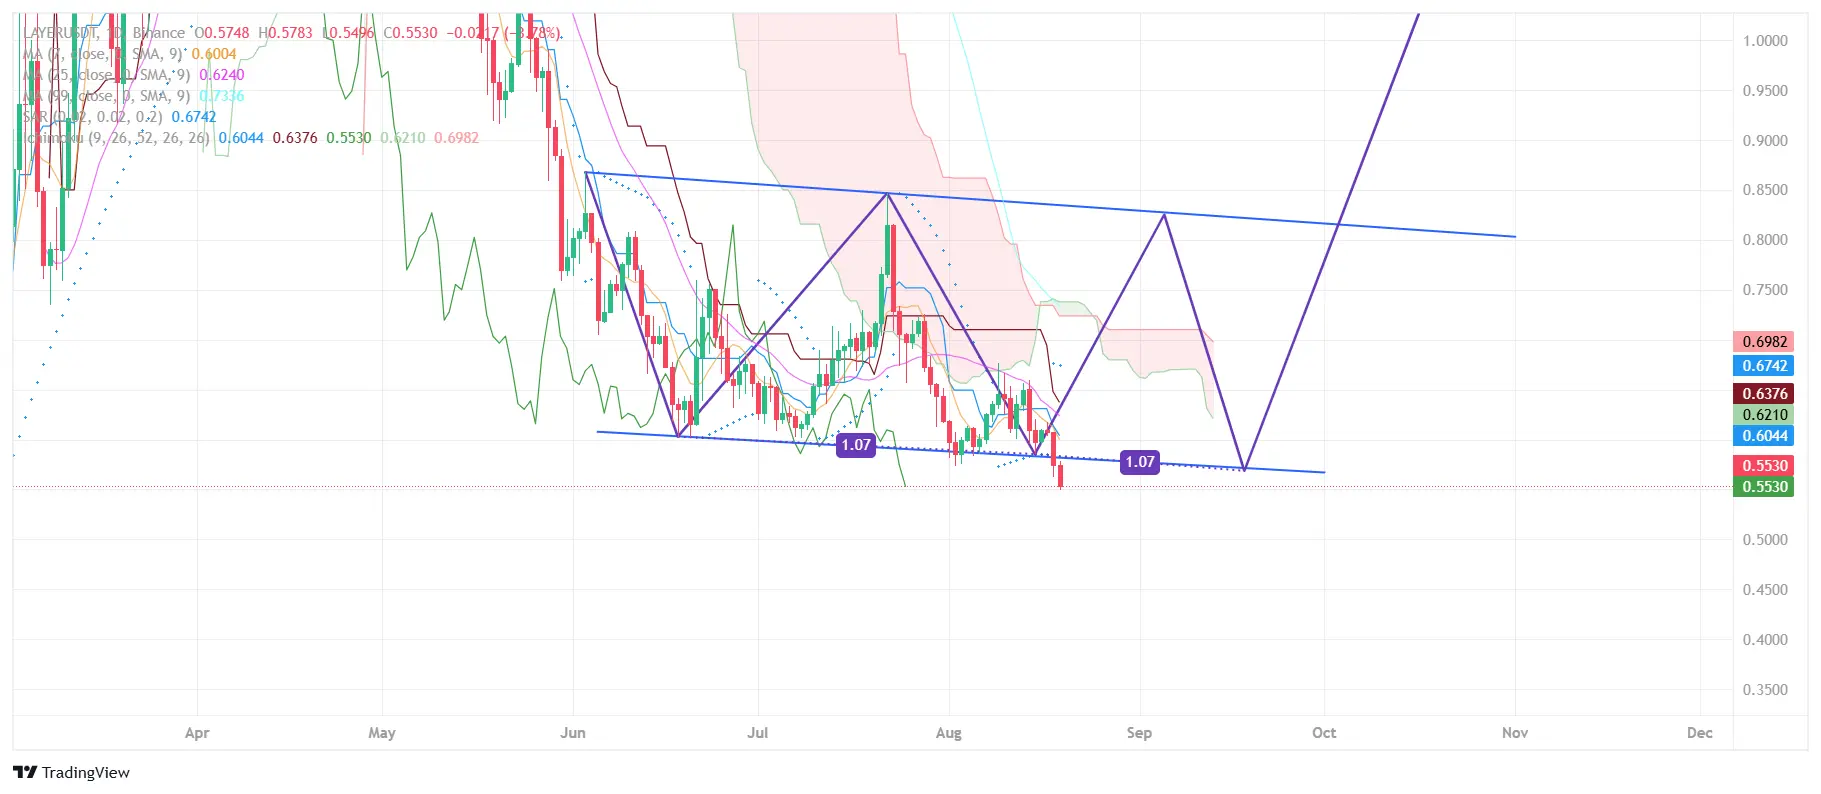
📉 Solayer (LAYER/USDT) Technical outlook
The price is again testing the support zone around $0.55 🔑 on the chart. We see the formation of a descending wedge, which often indicates the potential for a reversal. If the level holds, a bounce to the resistance zone of $0.68 – $0.75 📈 is possible. A downward breakout poses a risk of falling to $0.50.
⚡ About the project: Solayer is a restaking and liquid restaking protocol for Solana 🌊. Users can stake SOL or LST tokens, earning rewards for supporting AVS and other solutions within the ecosystem. This enhances decentralization and brings new us
LAYER-2.79%
SOL-2.09%
DEFI11.35%
View Original
post-image
  • Reward
  • 4
  • 1
  • Share
Xsainsvip:
Paying Attention Carefully🔍
View More
The strategy recorded the purchase of 430 BTC for approximately $51.4 million at an average price of about $119,666 per bitcoin. 🟢 This move indicates high confidence in the further rise of the asset 🚀, although the entry level looks aggressive and is more aimed at the long-term perspective.
BTC-0.65%
View Original
[The user has shared his/her trading data. Go to the App to view more.]
  • Reward
  • Comment
  • Repost
  • Share
BNB +2.76% in 24 hours 🚀. EMA and MACD show bullish momentum, but capital flight is being recorded. The BNB Chain ecosystem is growing, and the community is waiting for new peaks of $900–$1200.
BNB0.23%
View Original
[The user has shared his/her trading data. Go to the App to view more.]
  • Reward
  • Comment
  • Repost
  • Share
📊 Spot #BTC and # ETH ETFs have shown a record volume of ~$40 billion in a week 🚀 The growth of interest in #Ethereum ETFs was especially notable. This level of liquidity puts them in line with the top 5 ETFs and top 10 stocks in the market. The crypto industry is becoming more and more integrated into traditional finance 🌐🔥
BTC-0.65%
ETH0.88%
IN-5.31%
[The user has shared his/her trading data. Go to the App to view more.]
  • Reward
  • Comment
  • Repost
  • Share
  • Topic
  • Pin
Trade Crypto Anywhere Anytime
qrCode
Scan to download Gate App
Community
English
  • 简体中文
  • English
  • Tiếng Việt
  • 繁體中文
  • Español
  • Русский
  • Français (Afrique)
  • Português (Portugal)
  • Bahasa Indonesia
  • 日本語
  • بالعربية
  • Українська
  • Português (Brasil)